Image library, student manual, and links to resources to quantify brain phenotype and perform a Quantitative Trait Locus analysis linking variation in the phenotype with chromosomal loci.
 About Bioinformatics
This module is a completely computer-based introduction to bioinformatics resources. This easy-to-adopt module weaves together several important bioinformatic tools so students can grasp how each is used in answering research questions. Students integrate information gathered from a website dedicated to the mouse brain (Mouse Brain Library), Quantitative Trait Locus analysis (WebQTL from GeneNetwork), bioinformatics and gene expression analyses (UCSC Genome Browser, NCBI Entrez Gene, and Allen Brain Atlas), and an information resource (PubMed).
Instructors can use these various websites in concert to introduce bioinformatic resources, as well as to teach the following: genetics from the phenotypic level to the molecular level, aspects of neuroanatomy and histology, statistics, QTL analysis, and molecular biology (including in situ hybridization and microarray analysis).
As a result, students will: discover the region(s) of the chromosome(s) influencing the phenotypic trait, generate a list of candidate genes (narrowed by expression data, find the in situ pattern of a given gene in the region of interest, look up the nucleotide sequence of the candidate gene, and find articles describing the gene.
Read the published article (from CBE–Life Sciences Education, Summer 2010, 9:98-107) about using free online resources to teach bioinformatics and neuroinformatics:
Download Bioinformatics Files
Students and Faculty can download the Image J Program (which runs the Bioinformatics module) and Bioinformatics Tutorialsfor free.
(1) Download the Image J Program (from the NIH Website):
(2) Download the ‘All Mice’ folder, the complete set of images (taken from the MBL Website):
(3) Download the Bioinformatics Tutorials: In order to access the Tutorials Folder, you must first fill out the User Consent/Download Question (after which you will be directed to the download folder). Note that you will still be allowed to download the tutorials even if you choose NOT to consent to anything.
Download the Tutorials now:
Included in the Tutorials Folder are the following files:
- Complete Users Manual (.pdf for both students and instructors)
last updated: 08-27-09
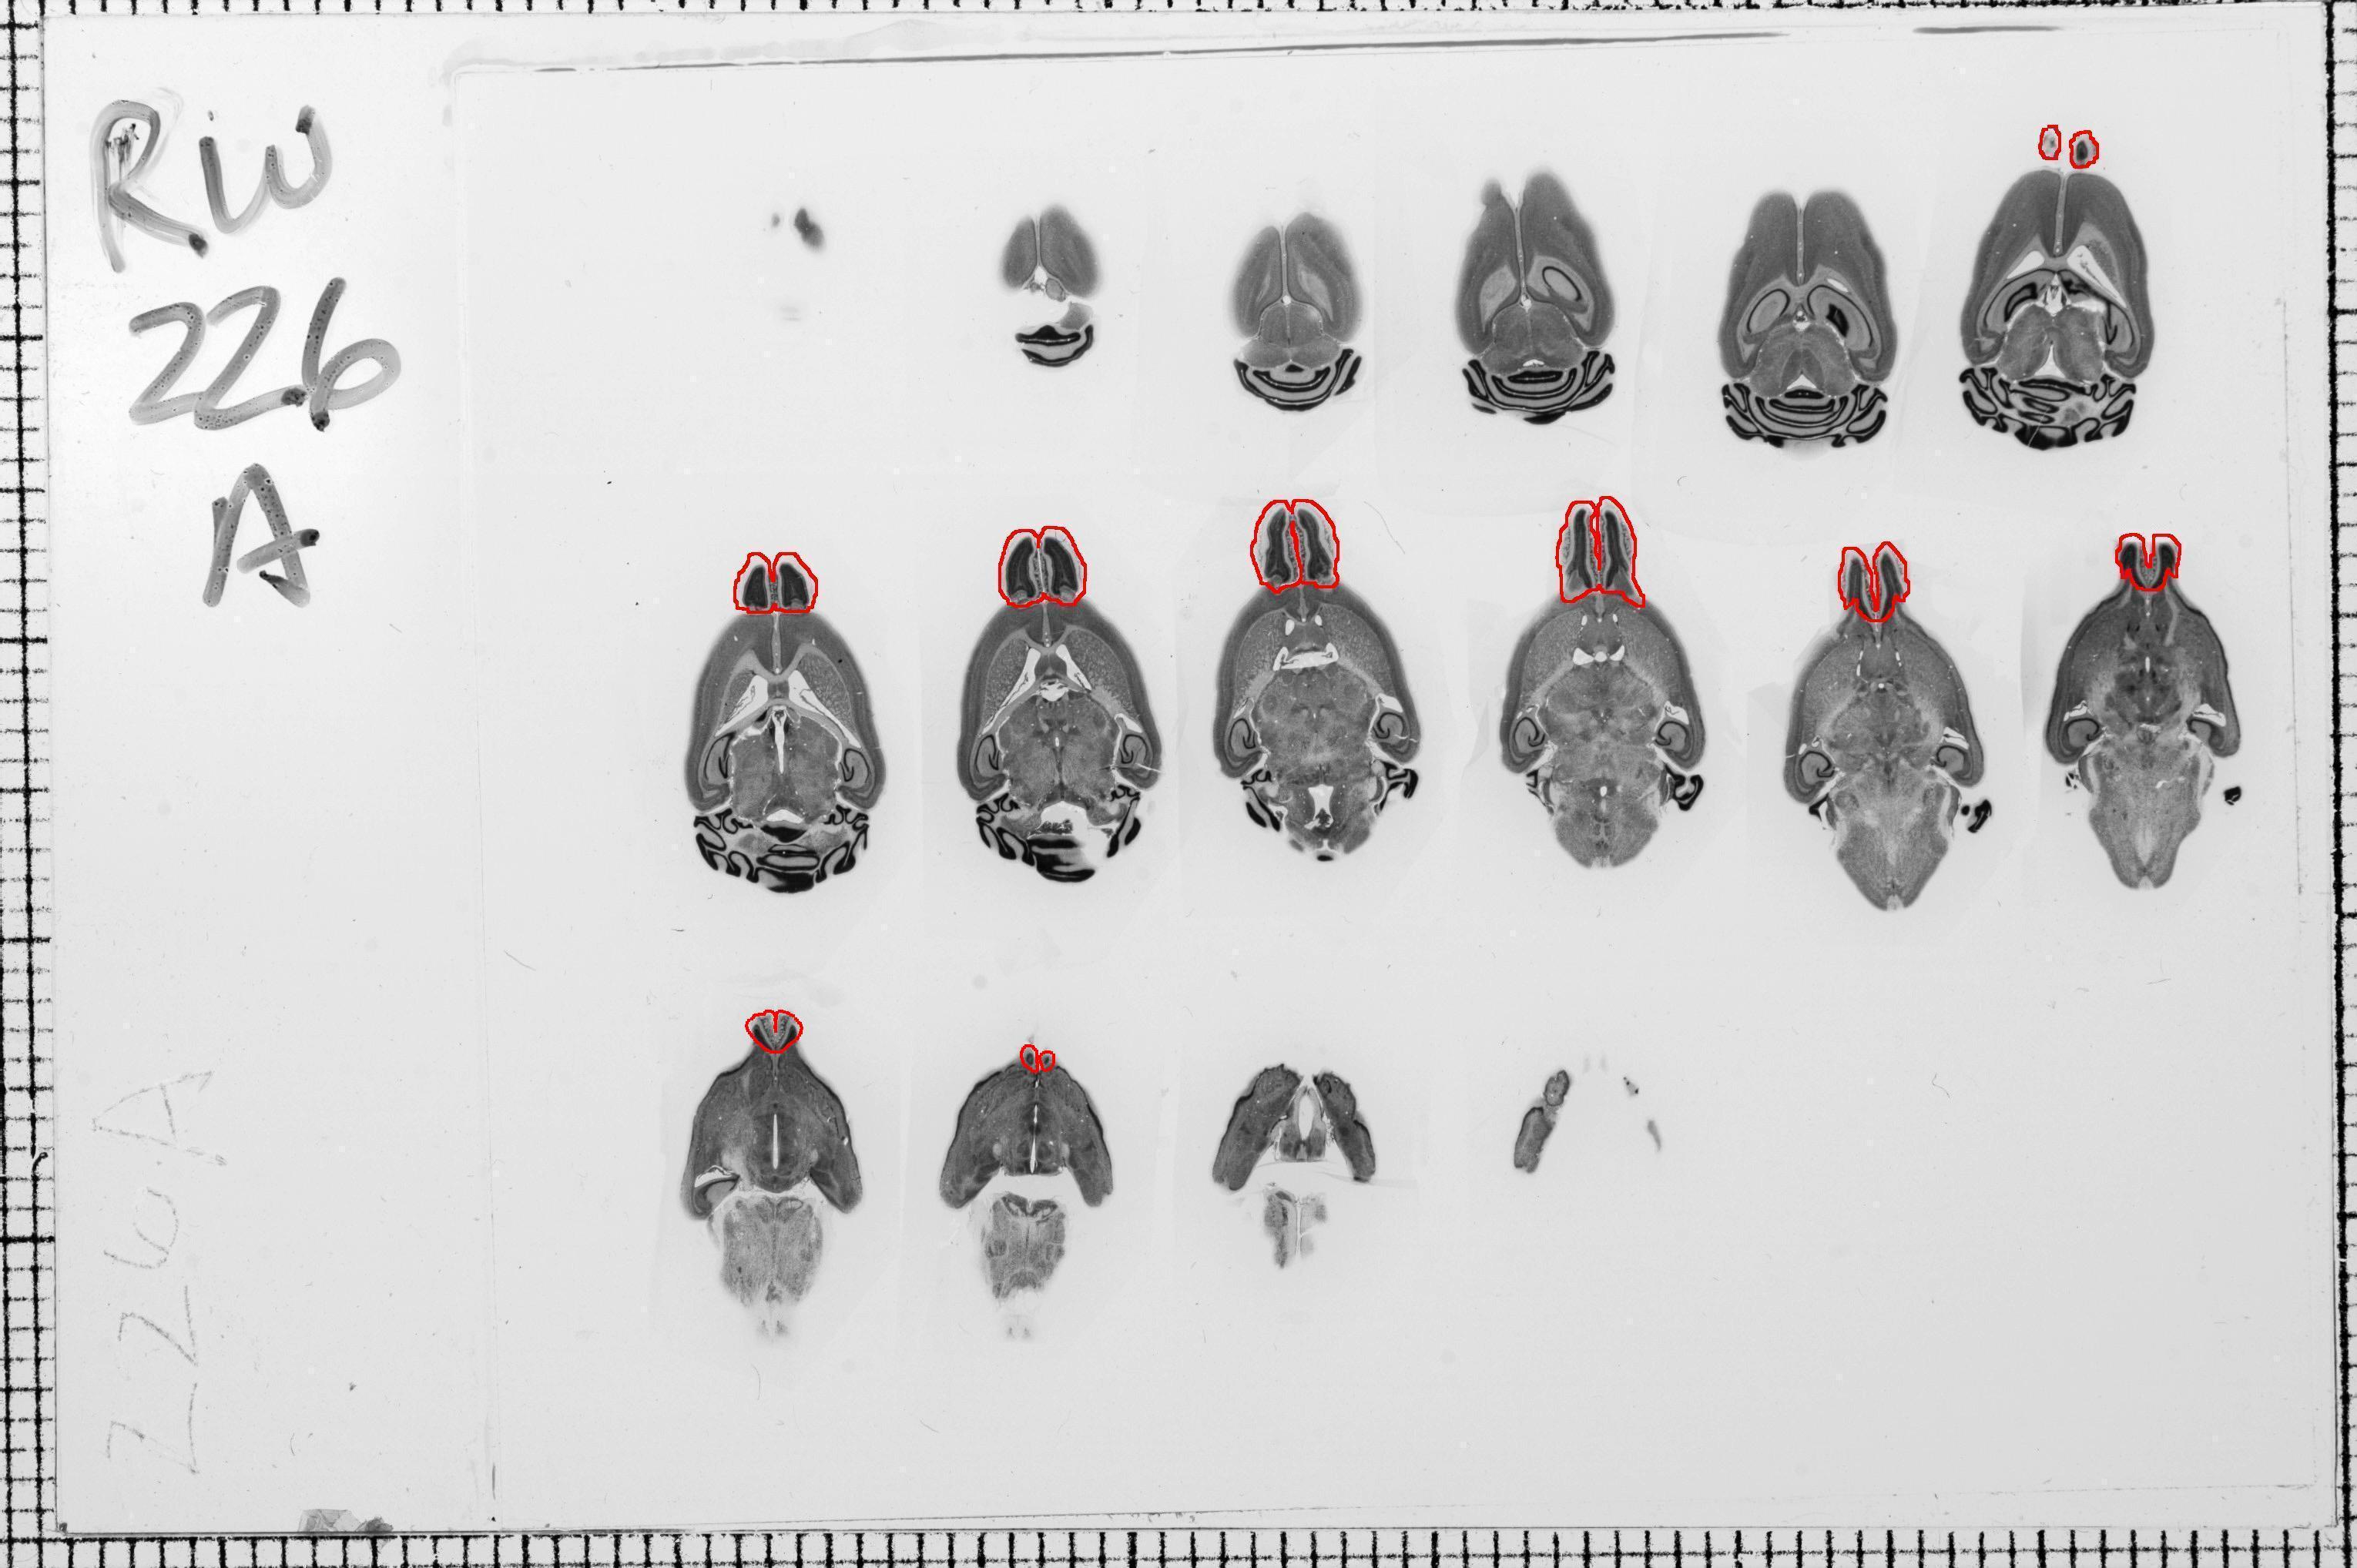
- Tutorial Part 1 of 8: Using Image J to Measure Olfactory Bulb Volume (.pdf)
last updated: 2009-09-21
- Tutorial Part 2 of 8: Using Image J to Measure Whole Brain Volume (.pdf)
last updated: 2009-09-21
- Tutorial Part 2 of 8 Supplement: Template with Mouse Demographics for Collected Data (.xls)
last updated: 2009-09-08
- Tutorial Part 3 of 8: Using SPSS to Run Regression (.pdf)
last updated: 2009-09-21
- Tutorial Part 3 of 8 Supplement: Template with Averaged Residuals for Statistical Data (.xls)
last updated: 2014-12-08
- Tutorial Part 4 of 8: Using Genenetwork/WebQTL to Analyze Trait Data (.pdf)
last updated: 2011-01-11
- Tutorial Part 4 of 8 Supplement: List of BxD Markers (.xls)
last updated: 2009-03-26
- Tutorial Part 5 of 8: Using UCSC Genome Browser to Find Genes (.pdf)
last updated: 2009-09-22
- Tutorial Part 6 of 8: Using Allen Brain Atlas to Find Gene Expression (.pdf)
last updated: 2009-09-22
- Tutorial Part 7 of 8: Using Entrez Gene to Find Full and Coding Sequences (.pdf)
last updated: 2009-09-22
- Tutorial Part 8 of 8: Using PubMed to Find Related Articles (.pdf)
last updated: 2009-09-22
(4) Class Data: Median Un-shrunk Olfactory Bulb Volumes and respective demographics. Import into statistics software (e.g. SPSS) to yield residuals.
(5) View Lecture and Lab Materials: The following are PowerPoint files that should serve as a guide to Bioinformaticsinstruction. Each lecture, taught by Dr. William Grisham (UCLA), is available with and without voiceover. Labs 2 and 3 have been combined into a single file; they can be combined and taught as a single lesson, or they can be split into two lab classes.
Lecture 1:
Lecture 2:
Lecture 3:
Lab 1:
Lab 2 and Lab 3:
(6) Watch the lectures: If you would like to view a series of lectures given by the teacher and developer of the Bioinformatics/Neuroinformatics module, please follow the links below.
- Bioinformatics Lecture Part 1 of 3 (from 2009-01-26)
- Bioinformatics Lecture Part 2 of 3 (from 2009-02-02)
- Bioinformatics Lecture Part 3 of 3 (from 2009-02-05)
For Faculty
Faculty members interested in accessing faculty-related materials will need to obtain approved access. While we are still developing this website, please email natalie@psych.ucla.edu or wgrisham@g.ucla.edu using the email listed in your institution’s faculty directory so that we can verify you as an instructor. Please include your first and last name, and the names of the modules you wish to access.
Extras
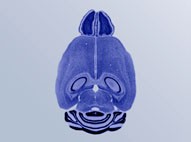
(1) View a large image detailing regions to select (trace and measure) in Image J:
(2) Practice running through the Bioinformatics/Neuroinformatics module with sample data:
- Sample Data (previously acquired data to be used for practice)
(4) Read the published article (from CBE – Life Sciences Education, Summer 2010, 9:98-107) about using free online resources to teach bioinformatics and neuroinformatics:
Need Help?
- Bioinformatics FAQ
- Email natalie@psych.ucla.edu or wgrisham@g.ucla.edu (with “Bioinformatics Question” in the subject line).
Related Links
- NIH Image
- Scion Corporation for free imaging software
- Mouse Brain Library
- GeneNetwork/WebQTL
- UCSC Genome Browser
- Allen Brain Atlas
- NCBI Entrez Gene
- NCBI PubMed
License Information
![]()